Today I saw a tweet about income inequality in the United States. I responded with a factoid I came across a few weeks ago:
I thought it was interesting. We’re told it’s bad half of all American income goes to the “top 10%.” However, the roster which makes up the “top 10%” is different each year. If you look at everybody in it, not just the people for one year, you find the “top 10%” actually includes 56% of Americans.
This was the response I got (via a screenshot as the tweet was apparently deleted):

Given the non-responsiveness of that response, I decided to think about the issue more on my own. The more I did, the more I came to believe the situation is quite strange. To test my beliefs, I decided to create a simple computer model.
For this model, I made some simple assumptions. I assumed there was a population of 10,000 people who all began with an income of $10,000. Each year, each person obtained an average growth in income of 1.5% (with a standard deviation of .5%) of the population’s average income. These numbers obviously don’t reflect reality, but they’ll give us something to work with. Here is what the model says is the average income after ten years of growth:
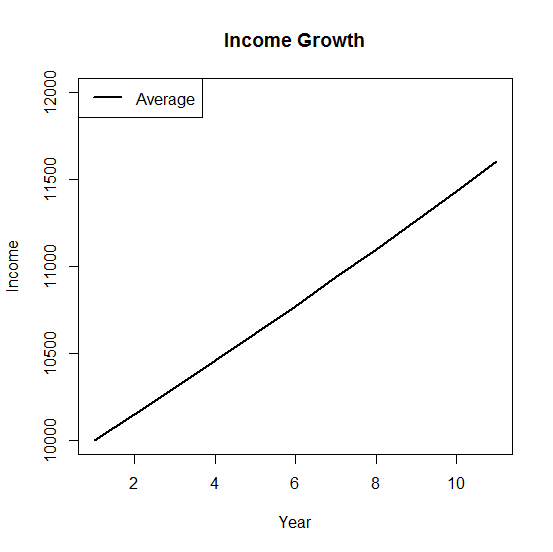
No surprise there. The average income for the population went up by 1.5% each year, exactly what I programmed the model to do. Let’s add another line though. Let’s compare the average income to the income of the top 1% of the first year:

As expected, there’s a notable jump in income in the first year because we took the top 1% of that year. That gap doesn’t grow though. In this model, income inequality does not grow. That may be unrealistic, but it is built into the model. That means if we look at the top 1% of each year, we shouldn’t see any change in income inequality:

But we do. Each year, the gap between the top 1% and the average person grows. It grows despite there being no growth in income inequality. It grows despite the rich people of any given year not growing richer. How is that possible?
Before I answer that, let’s consider a different example. What would happen if you looked at the win/loss ratio of the top 10% of football teams in the United States? You’d find they win ~80% of their games. Does that mean the top 10% of the football teams are too good?
Of course not. All it means is each year, the teams that do well will win most of their games. Which teams do well will be different each year though. The New Orleans Saints may do great one year and land in the top 10%. The next year they may do terribly and have some other team take their place. A year after that, an entirely different team may wind up in the “top 10%.” It sounds impressive when I say the “top 10%” of football teams win 80% of their games until you realize 80% of the teams may wind up in the “top 10%” at some point.
The same is true for income. The article I linked to at the start of this post says:
It turns out that 12 percent of the population will find themselves in the top 1 percent of the income distribution for at least one year. What’s more, 39 percent of Americans will spend a year in the top 5 percent of the income distribution, 56 percent will find themselves in the top 10 percent, and a whopping 73 percent will spend a year in the top 20 percent of the income distribution.
Compare that to what people complaining about income inequality say. The article which started my Twitter exchange said:
Today, we look at both sides of the income split and how they’ve traded places. For the first time in a century, the top 10 percent of Americans control more than half of all income.
It says “the top 10 percent of Americans control more than half of all income.” The other article says “56 percent [of people] will find themselves in the top 10 percent.” Combine the two articles, and we get, “56% of people control more than half of all income.” What a shock. Half of the people control half of the income!
Of course, those numbers matching up so well is mostly coincidental. They aren’t actually comparable. There really is income inequality in the United States. My toy model doesn’t dispute this. All it does is show we can create a false narrative of the “rich getting richer” by simply cherry-picking who the “rich” are each year.
To put this in more concrete numbers, here is a table of how many people appeared as the top 1% earners in my model and how many times they did so:
1	2	3	4	5	6	7	8	9
228	86	66	23	23	9	8	5	5
There were 100 people chosen each year for 10 years. Not a single person was chosen in all ten years. Only five were chosen in eight or nine years. The growing income inequality we found between the “top 1%” and the average person came entirely from including 453 different people in the “top 1%.” That is, we can find growing income inequality if we include ~5% of the people in our “top 1%.”
Does this disprove the notion there is a growing income inequality gap in the United States? Of course not. What it does do is show the foolishness of the current approach to discussing income inequality.
If there is a growing income inequality gap, we ought to discuss it. We just ought to discuss it in a sensible manner. We shouldn’t go around demonizing the “top 10%” as some singular entity while including 56% of the people in that “top 10%.”
That is, unless we’re prepared to condemn the NFL for letting the top 10% of teams win 80% of their games.

There’s also intelligence inequality, morality inequality, motivational inequality, mobility inequality, imagination inequality, opportunity inequality, envy inequality, arrogance inequality, wishful-thinking inequality, cleverness inequality, political inequality … Kinda lame only picking on income.
This is a good point that I have been making for years: the top ten percent keeps changing in its composition. Every time someone gets an income raise to $400,000 (or whatever the threshold is), they join the top ten percent, and someone else moves down from the top ten percent into the bottom ninety percent. A number of studies have shown that if you look at people by what quintile they’re in, and then look at the same people some years later, most have moved into a different quintile. From recollection I believe that more than 50 percent in the bottom quintile are in a higher quintile ten years later.
I am however surprised at the number 56 percent, partly because I didn’t know that anyone had been able to calculate it, and partly because it seems higher than I expected. Since the link to this “factoid” doesn’t work for me, could you supply the reference?
David Ramsay Steele, the link in this post is:
https://hiizuru.wordpress.com/2014/10/14/56-of-americans-are-in-the-top-10/www.nytimes.com/2014/04/20/opinion/sunday/from-rags-to-riches-to-rags.html
Which is obviously wrong. WordPress appended the correct URL to this page’s URL because it’s obnoxious (it likes to do that if you forget to include http:// at the start of a URL). The correct link is:
http://www.nytimes.com/2014/04/20/opinion/sunday/from-rags-to-riches-to-rags.html
I’ll get it fixed in the post.
Thanks. A fascinating article with several pointers to sources.
No prob. That article is one of the main reasons I wrote this post. I thought it was pretty interesting.
Though I really would recommend commenting at the new location for the blog. I don’t expect to post much, if any, new material to this one. All the old posts and comments were transferred over (save a few made after the transfer happened, such as these ones). You can find it at:
http://www.hi-izuru.org/wp_blog/
I’m thinking about changing the /wp_blog/ part to something more friendly. It won’t break any links If I do though. I can just have both /wp_blog/ and whatever the new one is go to the same sources.
This provoked me to give a talk, which is now up on YouTube: https://youtu.be/pJwftOw99as